One of the many benefits Visit Anchorage offers to members is listing analytics. We track when someone views or clicks on your Anchorage.net listing, and make this information available for you. Reviewing your Anchorage.net listing performance data can help you refine marketing efforts and maximize your Visit Anchorage benefits. When you plan your marketing strategies around listing analytics, you can make decisions that optimize your listing performance. For example, you can use analytics to compare performance before and after adding photos, amenity information, or a more detailed description, each of which help your listing in the eyes of users.
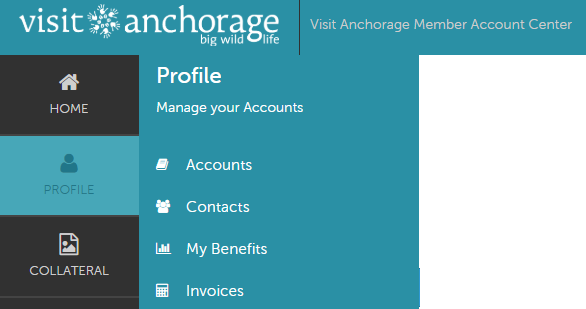
To find your listing performance data, log into the Member Account Center, then click on “Profile.” Select “My Benefits.”

Then select "Listings."

Below is an example of a graph summarizing the performance of a listing on Anchorage.net.

You will be able to see the total views and clicks on your listing over time. This data goes back to January 2017, which is when the new Anchorage.net website was launched. This ensures consistency in the type of data collected for your listing.
It's important to note that when you make changes to your listings, you should allow for some time to collect well-rounded data to better reflect the impact of those changes. For example, when Visit Anchorage staff make changes to webpages on Anchorage.net, we’ll allow one month to as much as four months to collect enough data to determine whether those changes were successful. Also, if possible, you would want to compare data year-over-year to account for web traffic patterns that vary based on the time of year. For example, compare July 2019 to July 2018.
These analytics provide a general sense of whether your listing is making an impression on visitors to Anchorage.net. The better the impression, the more likely it is they’ll visit your site to make a booking.
For more information or assistance, please contact your member representative.


